Monitoring Infrastructure at Behavox: Alerting


Greetings! My name is Alex Konyukov, the DevOps Engineering Manager at Behavox. Today, I am excited to share our journey of enhancing our monitoring processes.
It starts with an important decision: moving away from Zabbix. I will explain the reasons behind this change and shed light on the limitations and challenges we faced.
Next, I will introduce you to the powerful combination of VictoriaMetrics and Prometheus Alertmanager. These tools provided us with improved capabilities and efficiencies, significantly advancing our monitoring evolution. I will discuss the features and advantages that made them a compelling choice for our organization.
However, the most thrilling part of our journey was the decision to develop our own alerting solution. I will guide you through the reasons behind this choice, the unique requirements we aimed to meet, and the insights we gained from this ambitious project.
By the end of this post, you will better understand why creating a customized monitoring solution in-house can be the key to addressing your organization's specific monitoring needs. Join me as we explore how this tailored approach can revolutionize your monitoring strategy.
Zabbix
Our monitoring journey started with Zabbix, our initial choice for overseeing servers, services, and application activity. This tool proved reliable for more than five years. However, like all software, it had drawbacks that posed challenges for us as DevOps and Software Engineers. We encountered several key issues that limited our ability to expand and optimize our monitoring setup:
- We faced poor database performance with Amazon RDS PostgreSQL, even when using a pricey instance. This issue was particularly noticeable during peak times when dealing with 1 TB of data and 2,000 queries per second.
- Implementing a configuration-as-code strategy was complex due to the use of large JSON templates. Modifying these templates was nearly impossible without utilizing the Import/Export feature on a development instance.
- The Zabbix server itself became a weak point during deployment processes.
These ongoing challenges prompted us to explore alternative monitoring solutions.
VictoriaMetrics
Our requirements for a new monitoring system were simple: it should be able to handle 1.5 million metrics per day for each host across 1000 hosts.
We evaluated three options: Zabbix 5.0, Sensu Go and VictoriaMetrics, each competing to become a long-term part of our infrastructure.
After extensive testing, we found that Zabbix struggled with performance when we pushed it to the limit. While Sensu Go performed well with its configuration-as-code feature, it still had similarities to its ancestor, Nagios. Ultimately, we chose the VictoriaMetrics stack from the Prometheus ecosystem as our solution.
VictoriaMetrics had several advantages over Zabbix and other systems:
- It uses a time-series database, which provides efficient and scalable data storage. This type of database is designed for easy expansion as data grows.
- Its cluster architecture includes a high availability mode, ensuring continuous operation even during component failures.
- VictoriaMetrics simplifies our workflow by allowing us to manage configurations and alerts as code, improving deployment and maintenance efficiency.
- Most modern frameworks support Prometheus natively for metric provision, and VictoriaMetrics seamlessly replaces Prometheus.
Our VictoriaMetrics setup follows a standard cluster configuration, with a vmagent deployed on each instance. We use various Prometheus exporters and a simple Python script to accommodate metrics from older applications incompatible with Prometheus (our Zabbix legacy).
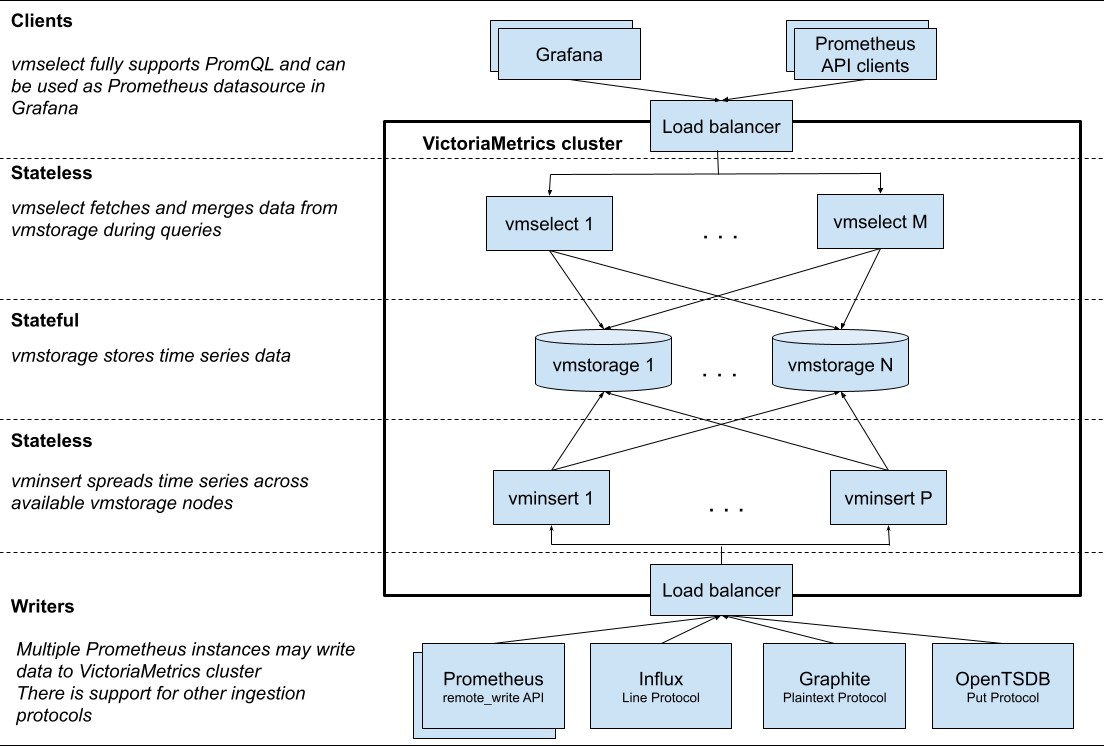
We have implemented a tri-zone architecture on AWS for improved reliability and scalability. This design distributes vminsert, vmselect, and vmstorage instances strategically across the cluster. We have used only two vmalert instances, utilizing their ample capacity.
In addition to VictoriaMetrics, we have integrated Prometheus Alertmanager, configured for high availability according to best practices. Both Alertmanager instances are connected to Opsgenie, an essential part of our monitoring framework. This integration ensures timely notifications for any critical issues that require our attention.
What could go wrong?
We started transitioning to a new system in March 2021. Despite careful planning to ensure a smooth shift for our Support and SRE teams, the process took a year and presented significant challenges.
The first challenge materialized when we restarted Prometheus Alertmanager to update configurations, which caused a large number of alerts to disappear in our Opsgenie system. These alerts were still active in Opsgenie but were no longer tracked by Alertmanager. We tried a rolling restart approach, but it didn't solve the problem.
A second challenge was alert dependency management. There were unexpected restarts on the monitoring host, resulting in up to 50 alerts per node type. This happened because Prometheus Alertmanager, as of 2021, lacks built-in support for alert dependencies, a feature that Zabbix excels at.
It's important to note that Prometheus Alertmanager does have the inhibit_rule feature. However, it falls short when creating dependencies between alerts at the instance and cluster levels, especially when a cluster-level alert doesn't have an instance label. The requirement for both the target and source alerts to have the same label values under the 'equal' list limits its effectiveness.
As a member of the Behavox monitoring team, I understand the frustration that our Support team experiences in managing these unnecessary alerts in Opsgenie.
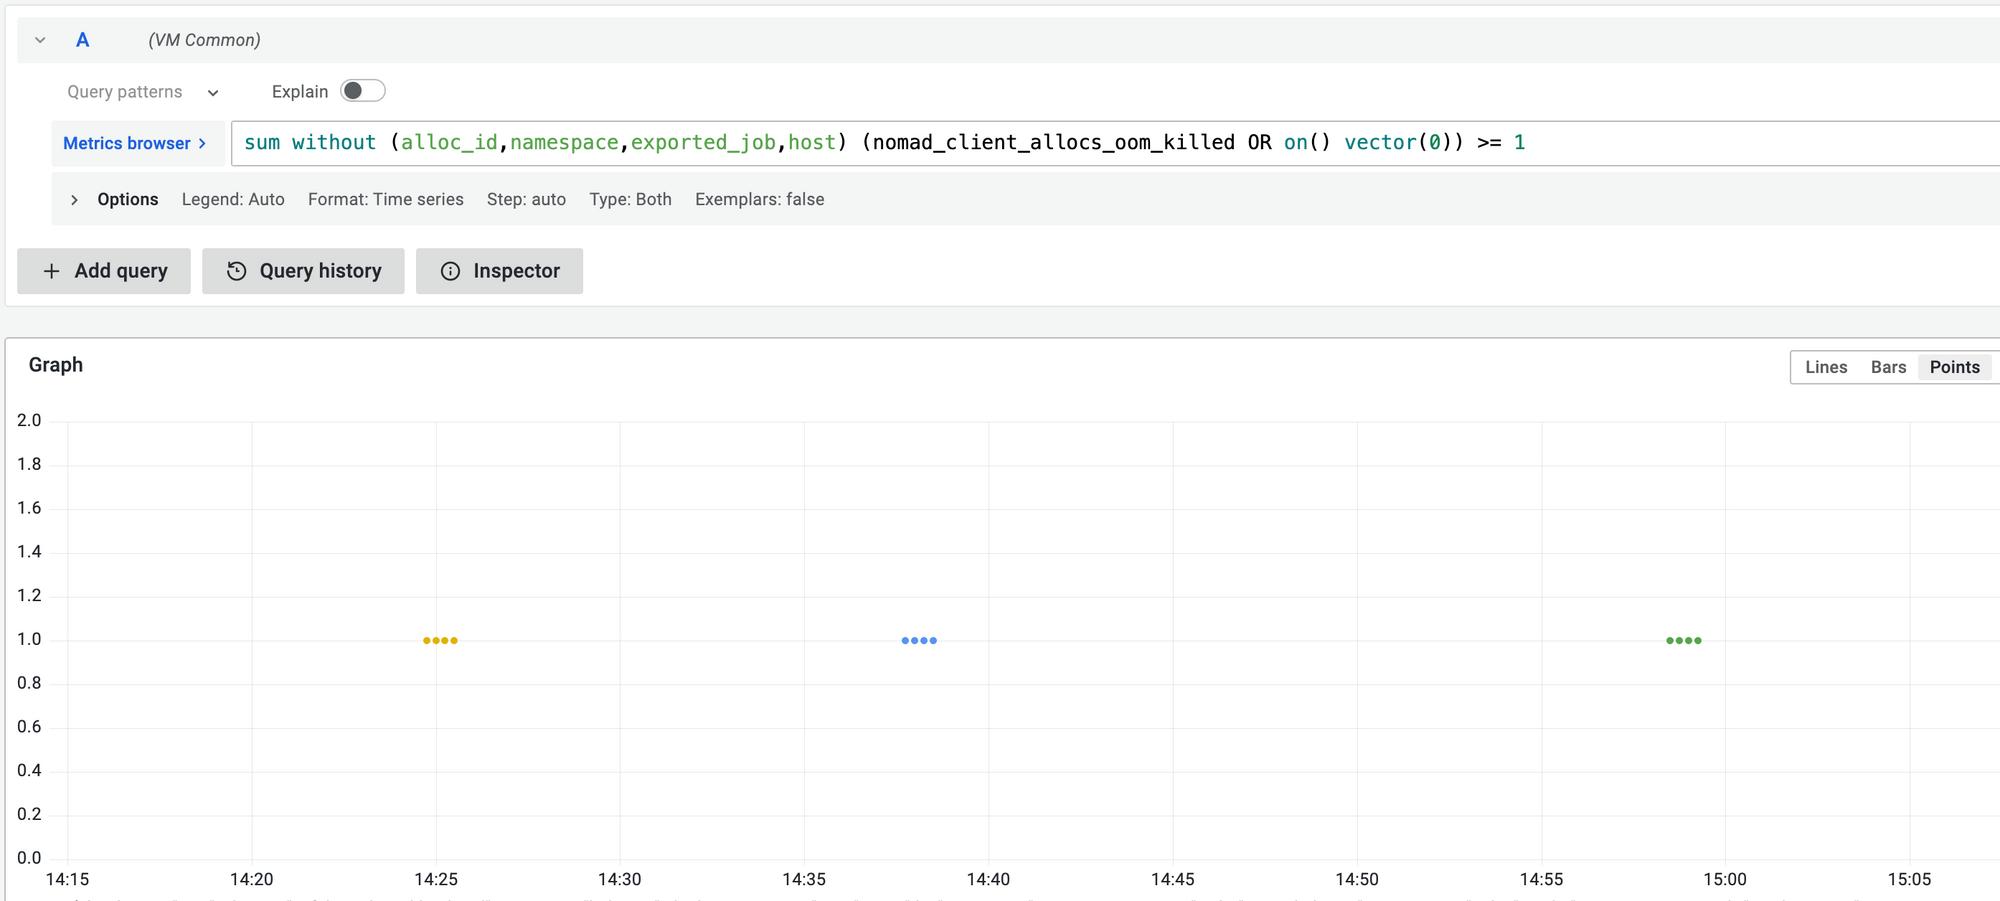
Another challenge involves short-term alerts, such as those related to Out-Of-Memory Killer (OOM killer) events. Alertmanager triggers these alerts, resolved so quickly that it confuses our monitoring system. While addressing this by turning off the send_resolved parameter is possible, it requires extra consideration and effort. We wanted something less error-prone.
Identifying the problem domain was easy, but my research into existing solutions showed no ready-made fix for our issues with Prometheus Alertmanager. As a result, I chose to develop a custom in-house solution tailored to our specific needs.
Hackathon 2021
A hackathon is an event where people engage in rapid and collaborative engineering over a relatively short period of time such as 24 or 48 hours.
At the Behavox Hackathon in 2021, participants were given approximately one day to create and demonstrate their products. I spent around 10 hours working on a proof of concept. Although I didn't finish on time, my main goal of validating the feasibility of my idea was accomplished.
After months of work, I created the first alpha version of VmAlarm.
Given that VictoriaMetrics includes a component called vmalert for generating alerts, I chose the name VmAlarm intentionally to reflect its main purpose: sending notifications and activating alarms.
In-house alerting solution
Requirements
The Alpha version of our project showed promising results, so we have planned further development for the end of Q1 2022. Our development started by gathering specific requirements.
Some key requirements for the solution are:
1. We need to utilize vmalert for sourcing alerts and be able to relay notifications through Opsgenie. This way, the whole team will be kept informed about any issues.
2. It should be possible to reopen alerts in Opsgenie if they are mistakenly closed. We also need a mechanism to manage alerts effectively to avoid losing important information.
3. We require support for multiple routing options to deliver alerts to the different teams. It should also have the functionality to send Opsgenie heartbeats to confirm the service's operational status.
4. The solution should provide a comprehensive set of metrics for monitoring. This includes a web interface allowing users to view cluster-level alerts and an API that enables managing maintenance modes for clusters and individual instances.
5. We need to implement OAuth 2.0 authentication to secure access to the web interface.
VmAlarm
In mid-April 2022, after multiple revisions and thorough testing, I finalized a stable version of VmAlarm.
Before deploying VmAlarm, I extensively validated its functionality. This involved testing different scenarios, such as unplanned restarts, transient alerts, and alert dependencies, ensuring the reliability and effectiveness of our new system.
After two weeks of careful testing and confirmation, we successfully launched VmAlarm on May 6, 2022

VmAlarm is a Python application that uses the Django web framework and MySQL for state management. Its design is optimized to address challenges like false-positive alerts, seamless updates, network issues, and self-monitoring capabilities. Here is a closer look at how it works:
- Internal Scheduler: VmAlarm has an internal scheduler, that retrieves data from vmalert every minute. This ensures consistent and accurate monitoring.
- Configuration Management: Unlike relying on SIGHUP signals for updates, VmAlarm automatically reads its configuration file in each loop, maintaining smooth operation and up-to-date settings.
- Internal Queues and API Requests: The application uses internal queues to manage communication with Opsgenie, reducing the volume of API requests. It also records all alerts' states in the database, improving tracking and management.
- Alert Processing Cycle: In each cycle, VmAlarm categorizes alerts into three queues: ADD (for new alerts), CLOSE (for resolving alerts), and EXCLUDE (for alerts to be ignored). It intelligently removes alerts associated with clusters or hosts under maintenance from the ADD queue. Additionally, it evaluates alert dependencies and automatically closes lower-priority alerts to streamline the active alert count in Opsgenie.
- Metrics Generation and Access: VmAlarm stores generated metrics in a MySQL table, making it easy to access and analyze. It focuses on exposing only the most critical metrics for streamlined monitoring.
- Heartbeats and Monitoring Alerts: Using the Heartbeats feature in OpsGenie, VmAlarm constantly monitors itself and sends notifications to the Support team in case of any issues with the monitoring system. This ensures a quick response and resolution.
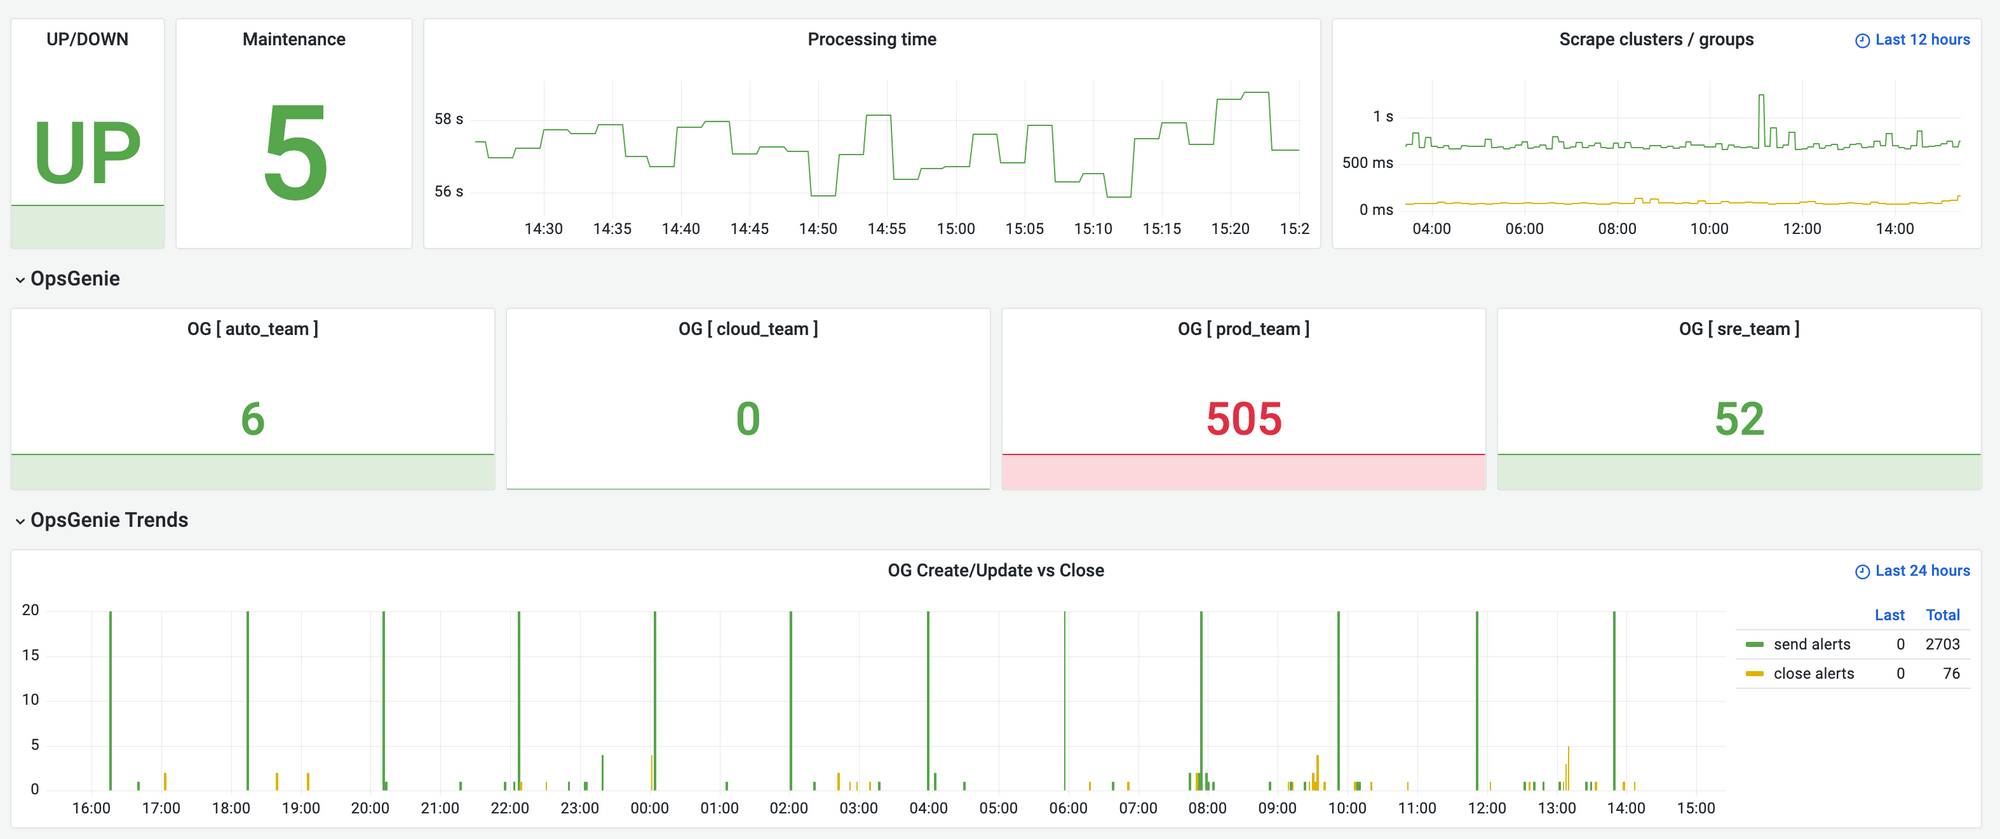
In addition to its technical capabilities, VmAlarm enhances team-specific monitoring by incorporating the concept of 'Teams'.
This functionality allows different teams to focus on specific clusters and alert groups, customizing monitoring to meet their unique requirements. With this inclusive approach and its other features, VmAlarm is a robust and reliable solution. It simplifies alert management, leading to positive outcomes for all stakeholders involved.
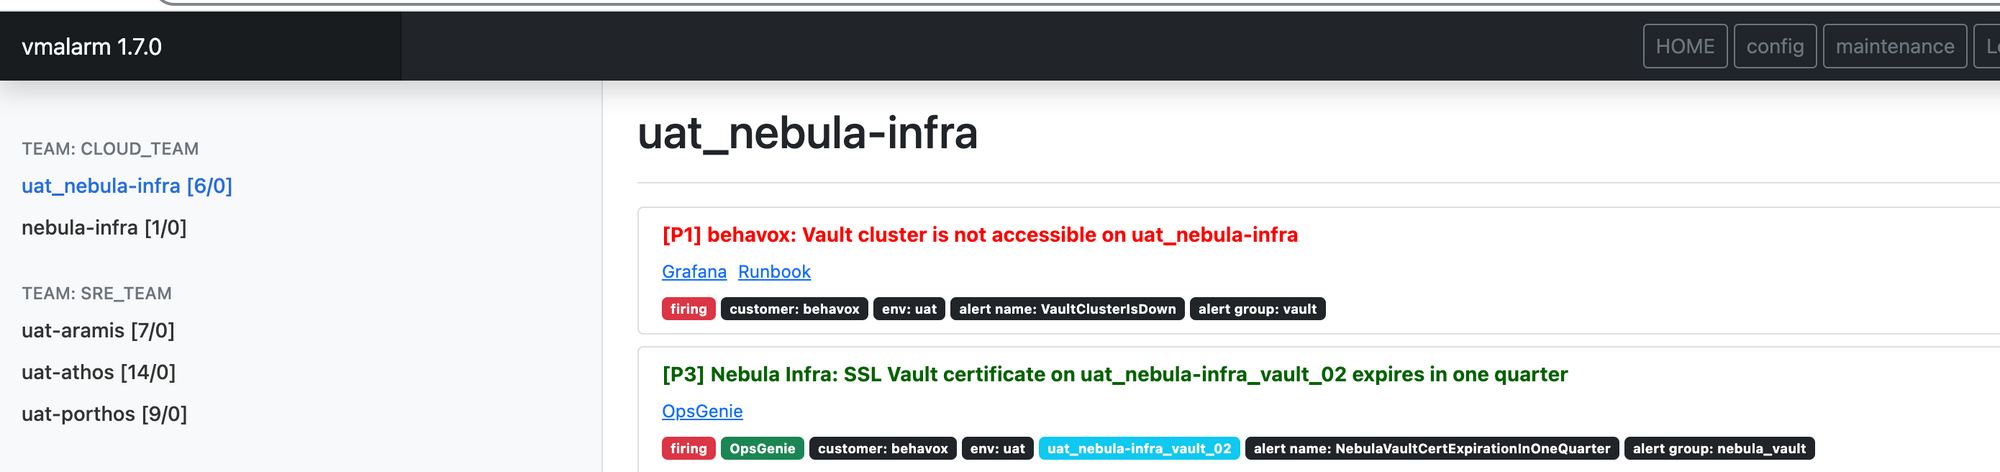
UI/UX
At Behavox, we understand the importance of a user-friendly interface in any application. Our findings suggest that the Prometheus Alertmanager interface may not fully meet the long-term operational needs and effective silencing management.
To address this issue, we have developed an interface that provides users with a comprehensive and clear view of the cluster's status. We used Bootstrap to create a simple yet visually appealing interface to achieve this. This interface not only focuses on aesthetics but also offers high functionality. Users can monitor maintenance activities, verify configuration updates, and access historical data.
Finale
After using VmAlarm for over a year, it is evident that developing this tool was the right decision. It has become an integral part of our team's workflow.
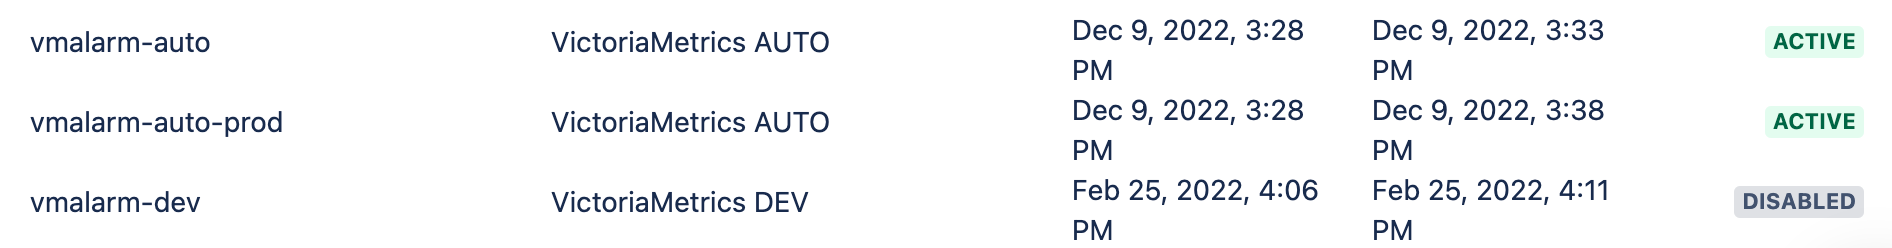
In recent months, we have upgraded VmAlarm to prepare it for our next product iteration. It now efficiently handles multiple alert sources by providing a unique vmalert for each product generation. To the best of our knowledge, no other Alertmanager tool currently offers this feature as a standard option.
Additionally, we are planning to make further enhancements to VmAlarm. The SRE team intends to incorporate a display of repeated occurrences for perpetual alerts in Opsgenie, as well as their count in the VmAlarm interface.
While we are considering the possibility of open-sourcing VmAlarm, this idea is still in the early stages of discussion.
🛠️ Behavox is looking for talented engineers to join us in building a world-class AI compliance solution. If you're interested, check out our careers page.